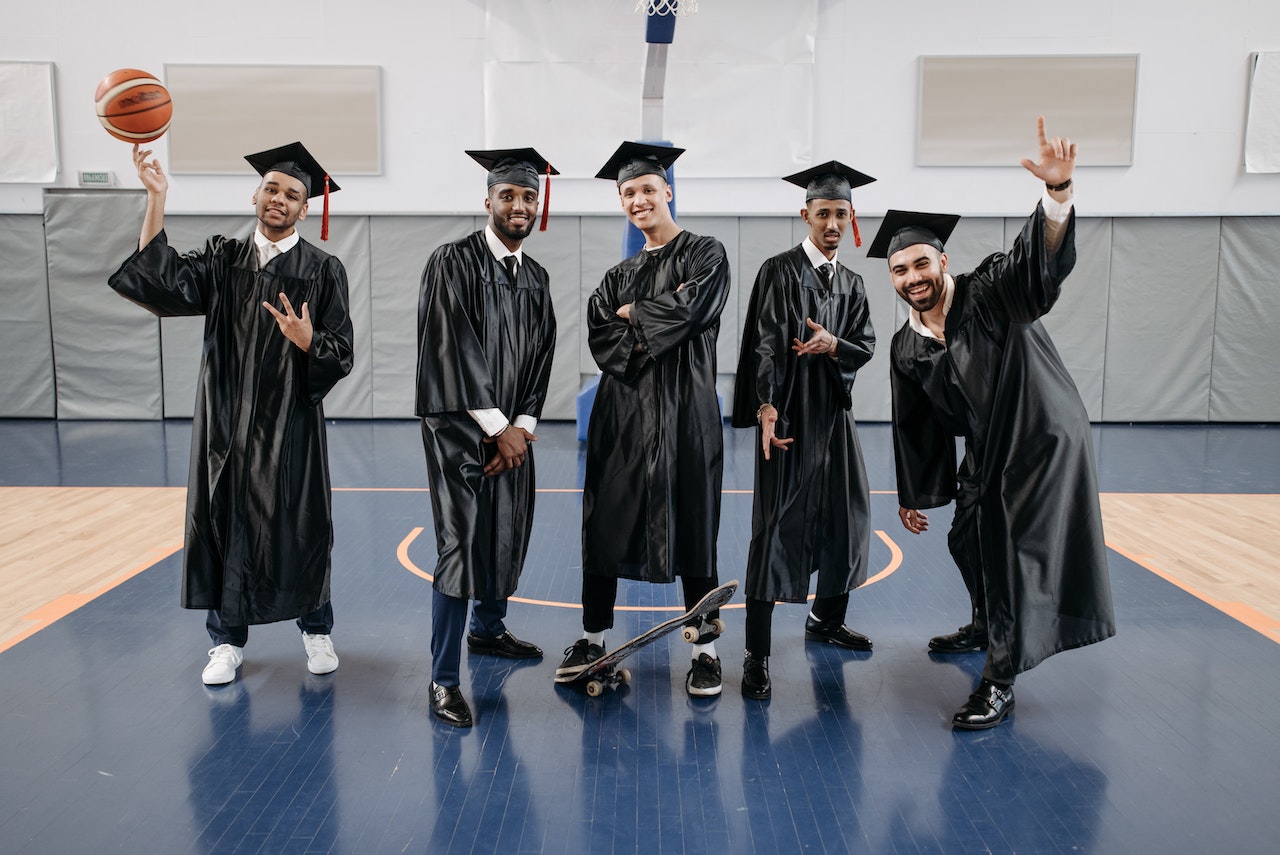
You need to begin with the end in mind. For many, that means the end goal of being a professional sports writer. That is, a writer who makes his (usually his) living from covering sports news and publishing articles on sports related topics – be it covering matches live, championships, covering sports betting odds (from …
Read More “Do you need to go to college to become a sports journalist?”
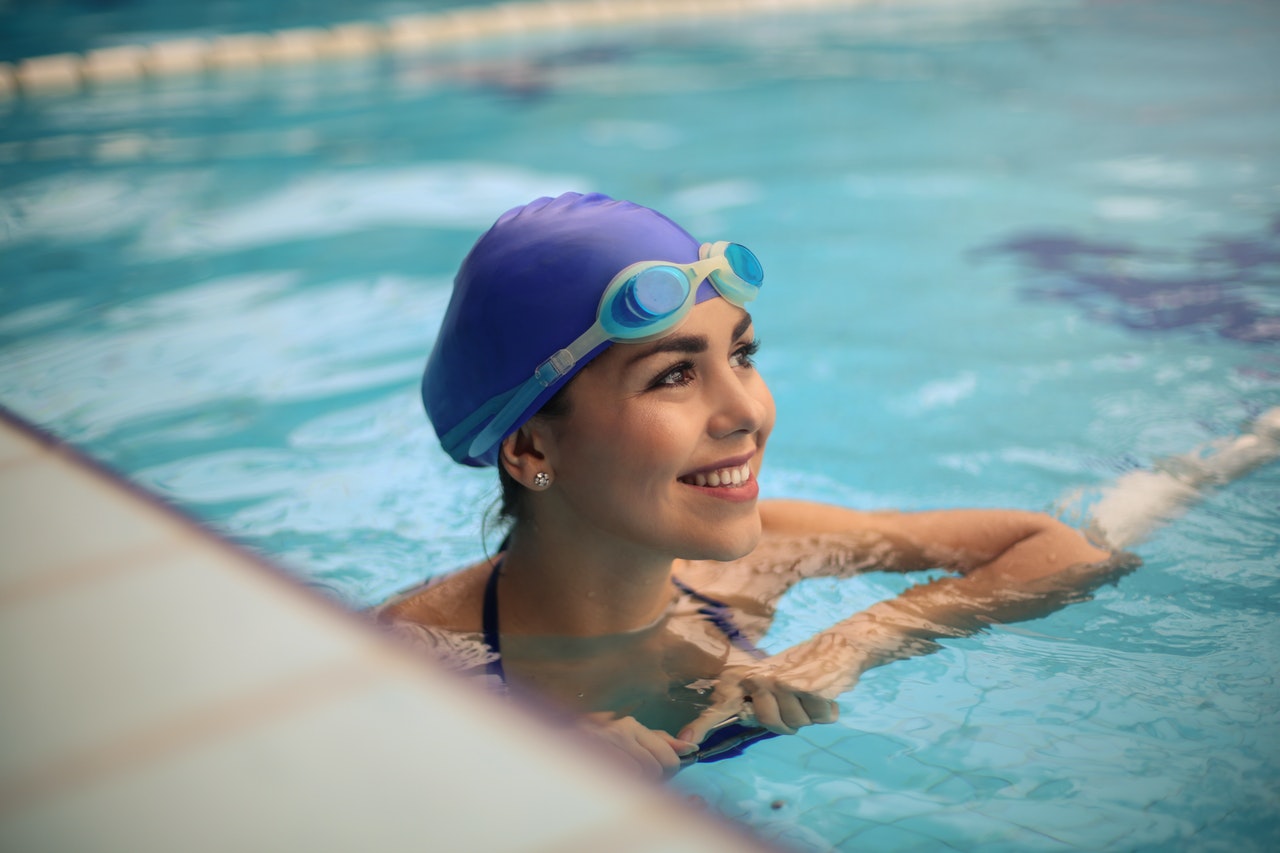
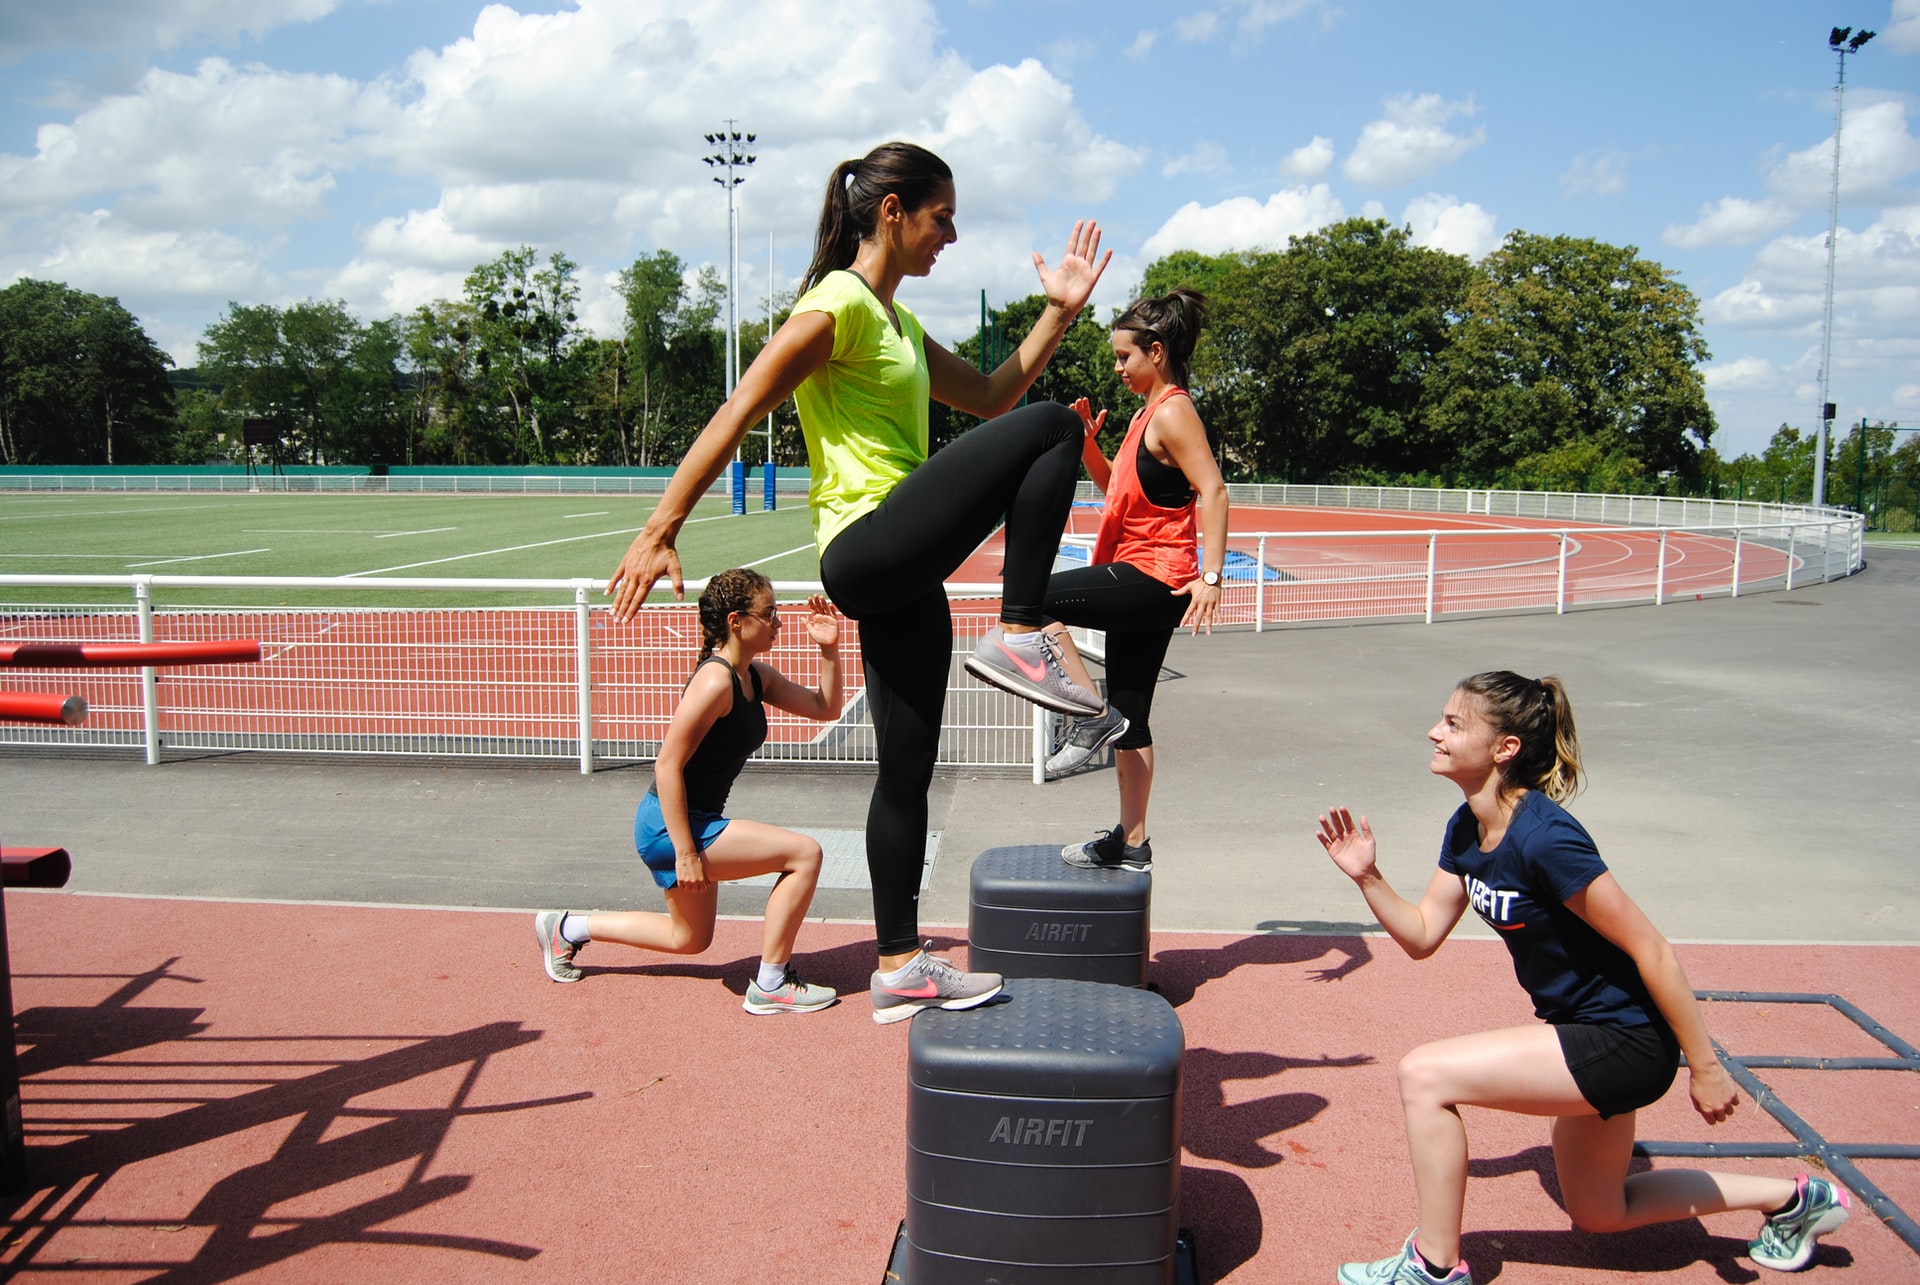
Swimming is a fun and relaxing sport to do and it can have many rewards. Using the swimming pool can not just be great exercise but you can also learn how to improve your form and technique. If you are looking for more information about how swimming works or the health benefits of swimming then …
Read More “The Benefits of Recreational Swimming”
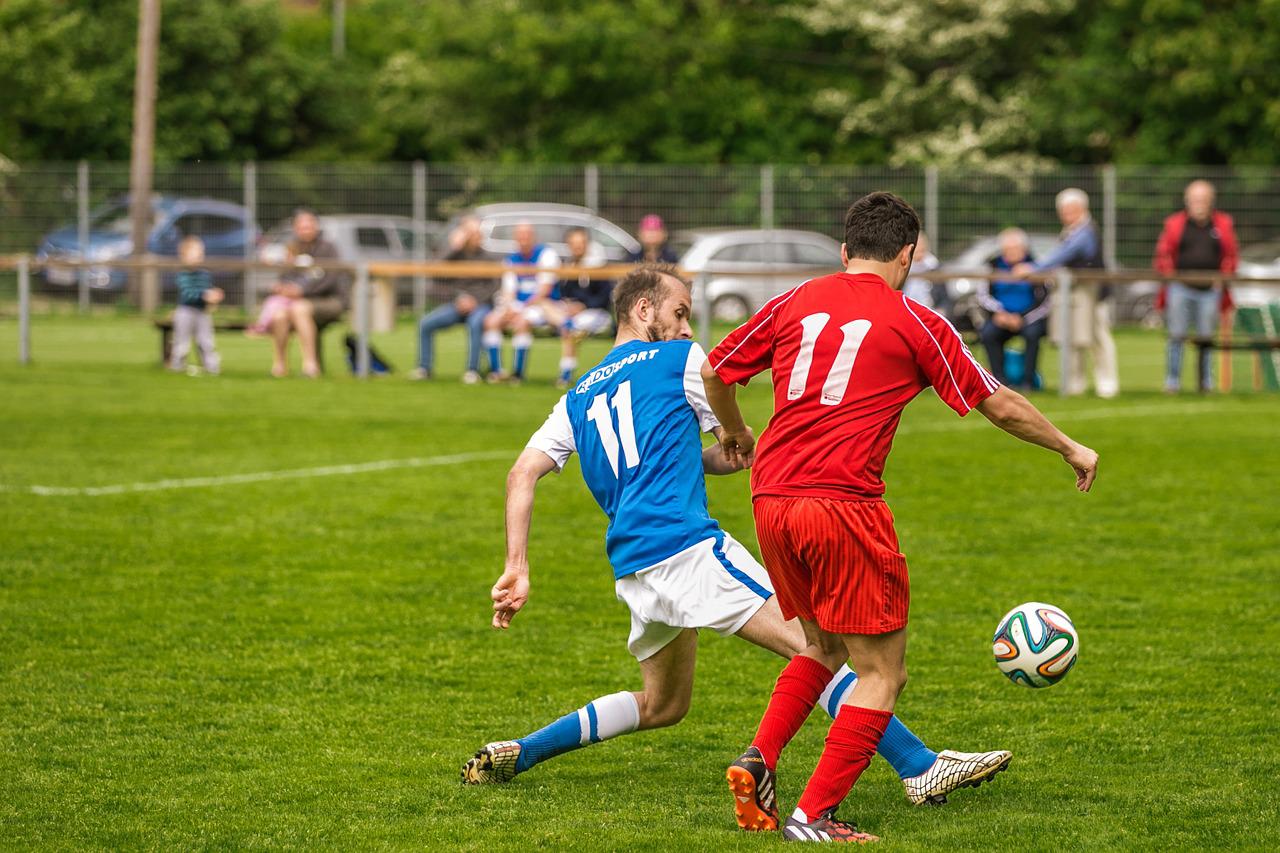
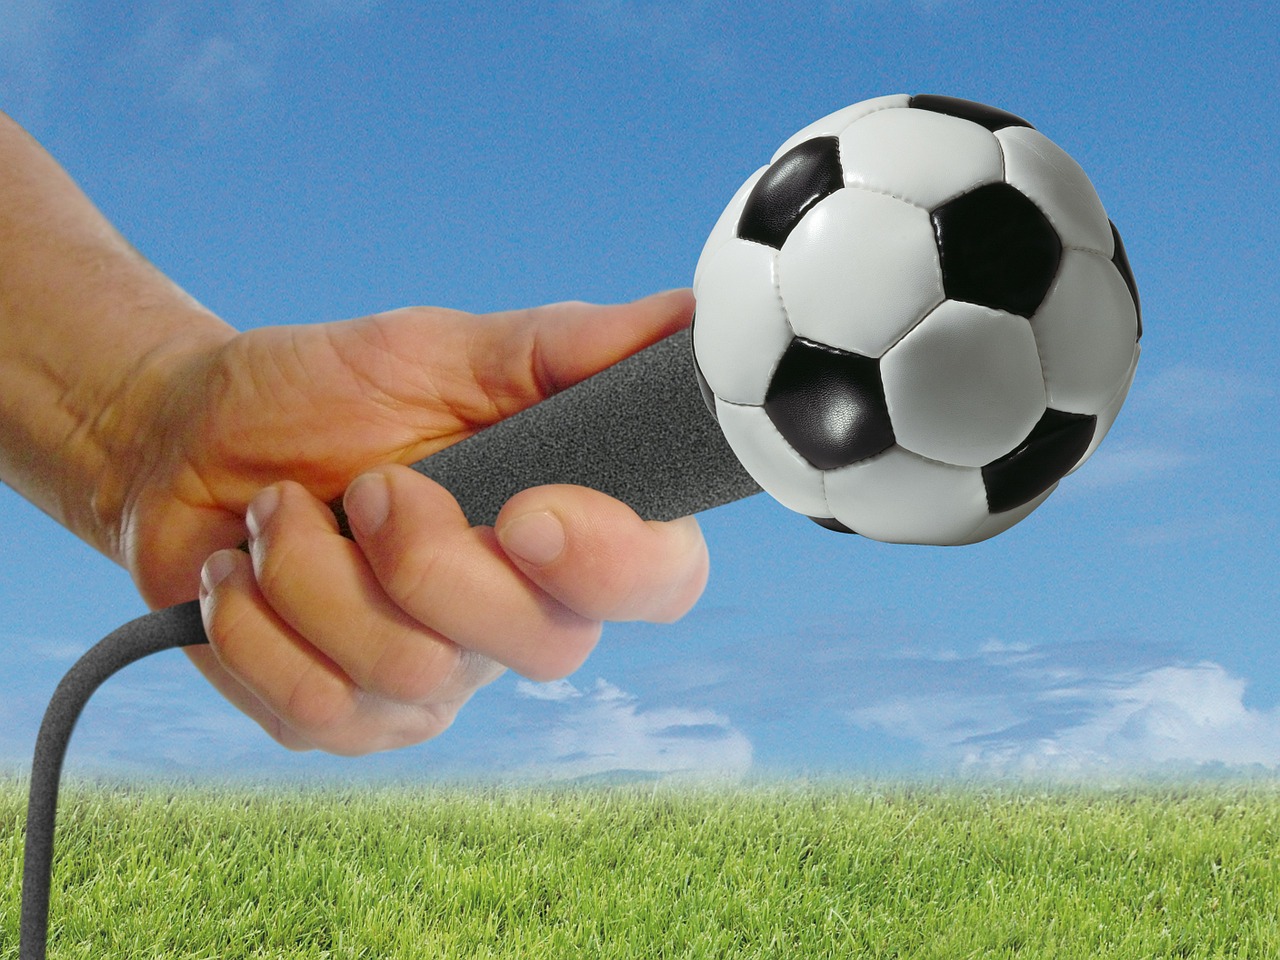
Most of us just watch soccer to cheer for our favorite teams and maybe even have fun with offers like the current Japanese bet365 promotion which can be accessed almost everywhere. Not a lot of people actually play soccer themselves. But if you fall in the latter category, we’re guessing that you already know how …
Read More “The Most Important Skills for Soccer Players”
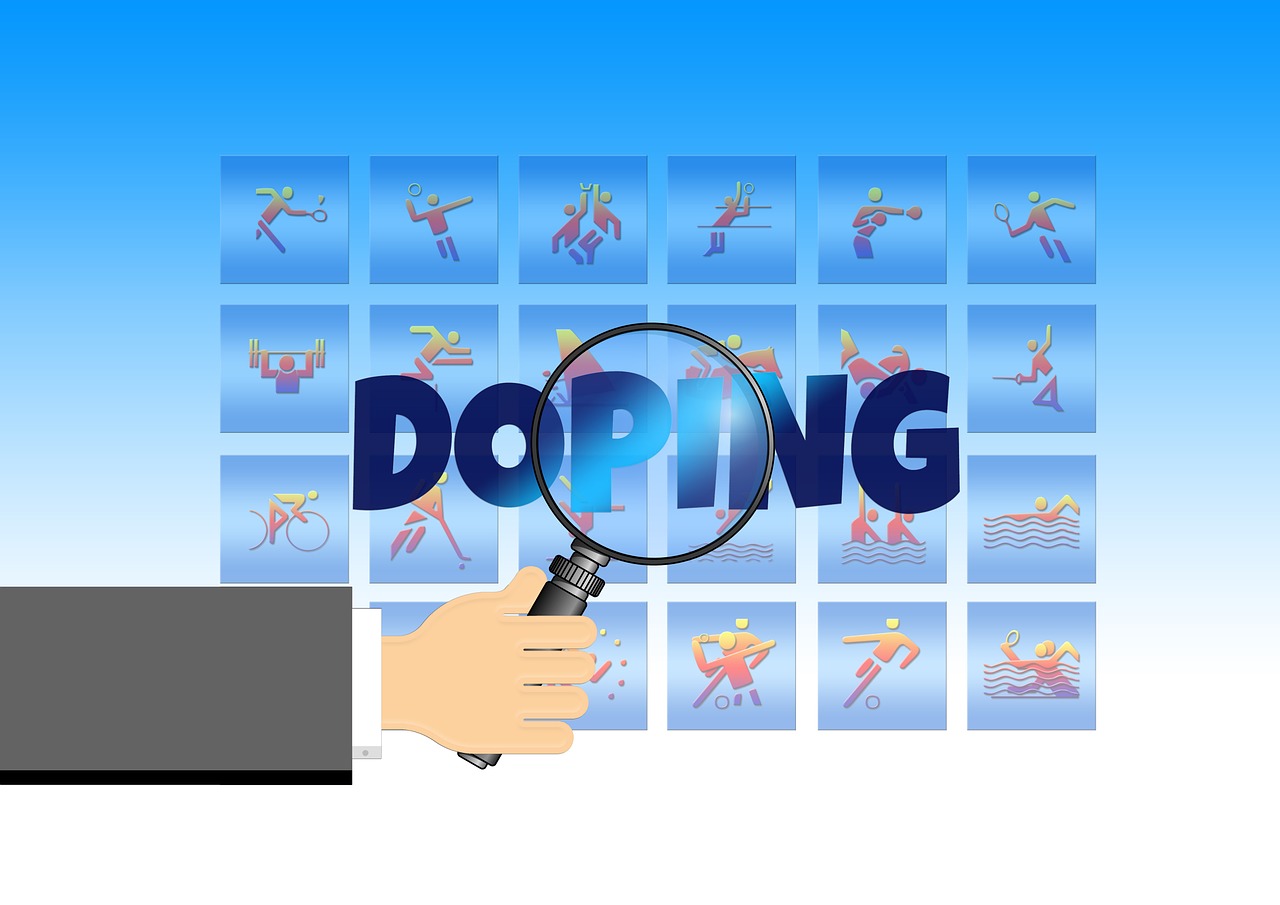
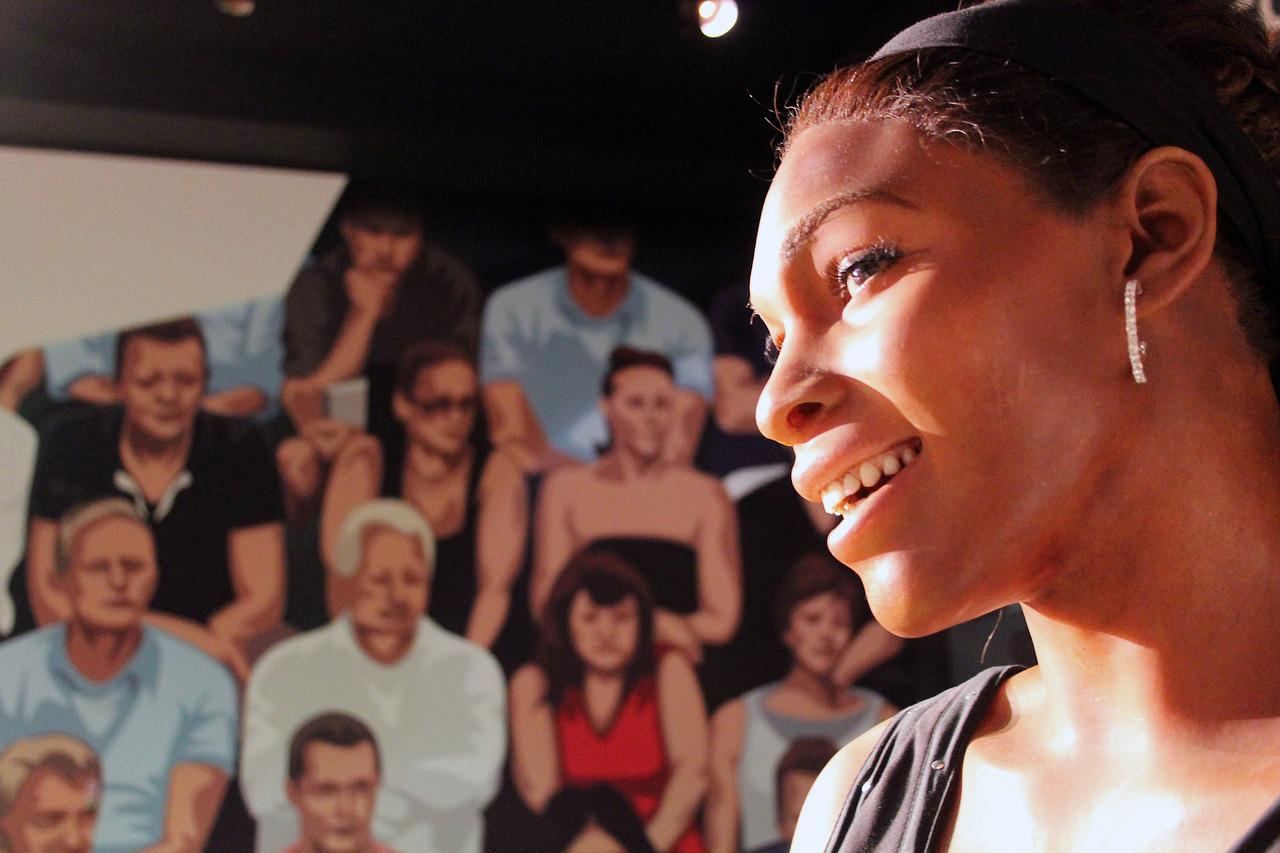
Everyone loves to talk about scandals, secret affairs and hidden stories of athletes. These situations create a lot of hype around both the individuals involved as well as their teams, leagues and stadiums. There are moments that have changed the history of sports forever. Black Sox Scandal The Black Sox Scandal was one of the …
Read More “Biggest scandals in the sports industry”